


Using Fibonacci Retracement in Market Analysis

In the quest for reliable guides through the twists and turns of crypto price action, Fibonacci retracement levels stand out as a popular tool. These levels, derived from the ancient mathematical ratio known as the “golden mean,” are neither magic formulas nor guaranteed predictions. Yet, many traders incorporate Fibonacci retracements into their analysis to identify potential support and resistance zones, anticipate market reversals, and refine their trading strategies.
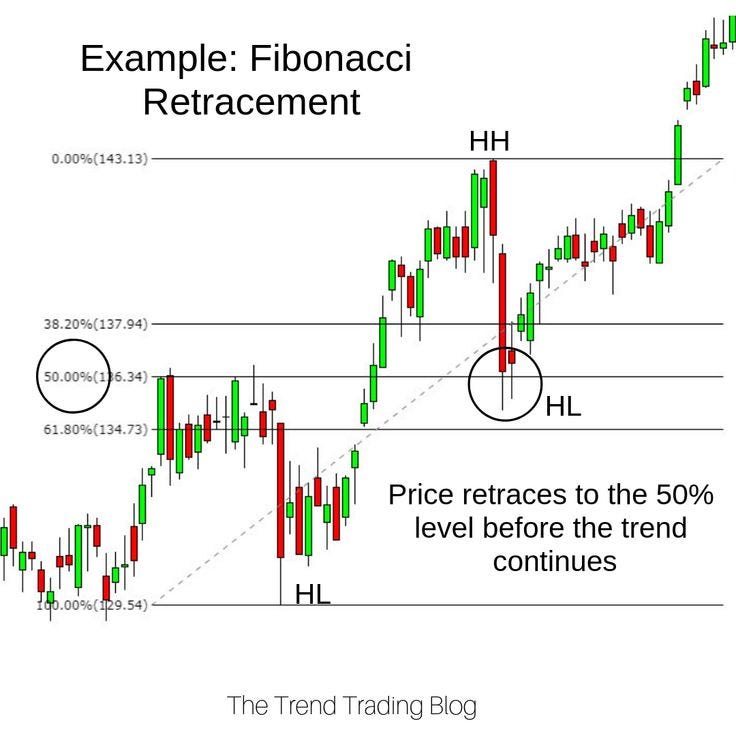
What Is Fibonacci Retracement?
Fibonacci retracement is a technical analysis method that plots key percentage levels between a significant price high and low. The most commonly used ratios are 23.6%, 38.2%, 50%, and 61.8%, along with 78.6%. Although the 50% mark isn’t a true Fibonacci ratio, it’s still widely observed. When a market makes a substantial move in either direction, these levels act as checkpoints where prices might pause, bounce, or reverse.
Why Do Fibonacci Levels Matter in Crypto?
Cryptocurrency markets are driven as much by psychology and crowd behavior as by fundamentals. Fibonacci ratios appear in nature, art, architecture, and human behavior, and traders see their influence in price charts as well. When many participants watch the same levels, these lines can become self-fulfilling prophecies—traders place buy orders near a retracement level, reinforcing it as support, or sell orders near another, turning it into resistance.
How to Draw Fibonacci Retracement Levels
1. Identify a Major Price Swing:
Start by locating a significant price move on your chart. For an uptrend, choose a major swing low and drag the tool up to a prominent swing high. For a downtrend, begin at a notable swing high and pull down to a major swing low.
2. Let the Tool Plot the Levels:
Most charting platforms have a built-in Fibonacci retracement tool. Once applied, it automatically overlays the selected ratios between your chosen points, displaying horizontal lines at each key level.
3. Observe How Price Reacts:
As price moves, note how it interacts with these levels. A bounce at 38.2% might signal that bullish momentum remains intact, while a failure to hold above 61.8% could indicate a deeper pullback is underway.
Support, Resistance, and Price Behavior
Because Fibonacci retracements divide a move into predictable segments, they often highlight where buying and selling pressure converges. For instance, if Bitcoin surges from $30,000 to $40,000 and then starts to correct, traders might look to the 38.2% level—around $36,180—as a potential area for price stabilization and renewed buying interest. Conversely, if a coin’s price struggles to climb past the 61.8% retracement level on a recovery attempt, that line could become a formidable resistance barrier, deterring bullish advances.
Combining Fibonacci with Other Indicators
Fibonacci retracements rarely act in isolation. Many traders blend these levels with additional tools to increase the reliability of signals:
1. Candlestick Patterns:
Look for reversal patterns—like a hammer or bullish engulfing candle—forming at or near a Fibonacci retracement line. Such confluence can strengthen the case for a turnaround.
2. Moving Averages (MAs):
If a 50-day MA aligns closely with a 61.8% Fibonacci retracement, that zone may carry extra weight. Multiple layers of support or resistance heighten the likelihood that price will respond.
3. Momentum Indicators (RSI, MACD):
Observe how momentum shifts around Fibonacci retracement levels. If RSI shows oversold conditions as price touches a key retracement level, it might hint at an upcoming bounce.
4. Volume Analysis:
Notice if volumes spike or dry up near a Fibonacci level. High volume at a retracement point could validate the strength of that level, while low volume might mean it’s less likely to hold.
Fibonacci Extensions and Targets
Beyond identifying support and resistance, Fibonacci can guide profit-taking and target-setting. After a correction, you can use Fibonacci extensions—levels beyond 100%—to estimate where the next wave of a trend might crest. Levels like 127.2% or 161.8% extensions can serve as projected price targets, helping you lock in gains before the crowd.
Adapting to Different Market Phases
The usefulness of Fibonacci retracement depends on market context. In strong uptrends, shallow retracements at 23.6% or 38.2% may be all you get before the next leg higher. During more turbulent times, assets might tumble to 50% or 61.8% retracement levels as investors reassess their positions. Recognize that not every move respects these ratios perfectly. At times, price might slice right through them, signaling that the current trend is losing steam.
Risk Management and Discipline
Just because a price reaches a Fibonacci retracement level doesn’t guarantee a turnaround. Always pair these insights with sound risk management. Set stop-loss orders in case price fails to rebound and continue monitoring market conditions. Remember that no single tool can eliminate risk entirely. Fibonacci retracements help you frame probabilities and identify logical reaction points, not ensure a certain outcome.
Practice and Refinement
Mastering Fibonacci retracements takes time. Start by applying them to historical charts to see how well price respected these ratios in previous market cycles. As you gain confidence, begin using them to guide real-time trading decisions. Keep a journal of your trades—note which levels worked, which didn’t, and how market conditions may have influenced the outcome. Over time, you’ll develop a keener sense of when Fibonacci retracements add value to your analysis.
A Powerful Lens, Not a Crystal Ball
Fibonacci retracement levels offer a structured way to interpret price behavior. They’re not predictive magic, but rather useful guidelines that help traders think in terms of probabilities and reaction points. By incorporating Fibonacci retracements into a broader analytical framework—one that includes price action, volume, sentiment, and fundamental factors—you can enhance the depth and confidence of your market analysis.
Join the Conversation!
Have you tried using Fibonacci retracements in your crypto trading or investing strategies? What are your favorite methods for confirming signals at these levels? Share your experiences, insights, and questions below, and let’s learn from each other’s journey to become more skilled and confident participants in the ever-evolving world of cryptocurrencies.